The Campaign Performance report can be used to get the data metrics for various posts like:
- Social Display
- CTV
- OLV
Metrics Available in Campaign Performance Report
The Campaign Performance Report section includes a summary of information about
- For CTV Creative
- Ads rendered = Impressions
- Clicks = Clicks on the Ad (Destination URL)
- CTR = Click-through rate
- Scan = QR code scans (If it has a QR Code)
- Scan Rate = QR Code Scan rate (If it has a QR Code)
- Video Metrics
- Video Starts
- Video Start Rate
- Video Quartiles (25%, 50%, 75%, and 100% Completions)
- 100% Completion Rate (ie. Video Completion Rate)
- For OLV Creative
- Number of Ads rendered = Impressions
- Clicks = the actual clicks on the video itself (if it has a click-out landing page)
- CTR = CTR (if it has a click-out landing page)
- Video Metrics
- Video Starts
- Video Start Rate
- Video Quartiles (25%, 50%, 75%, and 100% Completions)
- 100% Completion Rate (ie. Video Completion Rate)
For a comprehensive understanding of the Summary of Information, please refer to the complete definitions here
Learn more about the Social Display Campaign Performance Report here.
It also includes the daily breakdown of report for Video and Non-Video posts based on the creatives added in that campaign (i.e. if it's having Social Display creative as well).
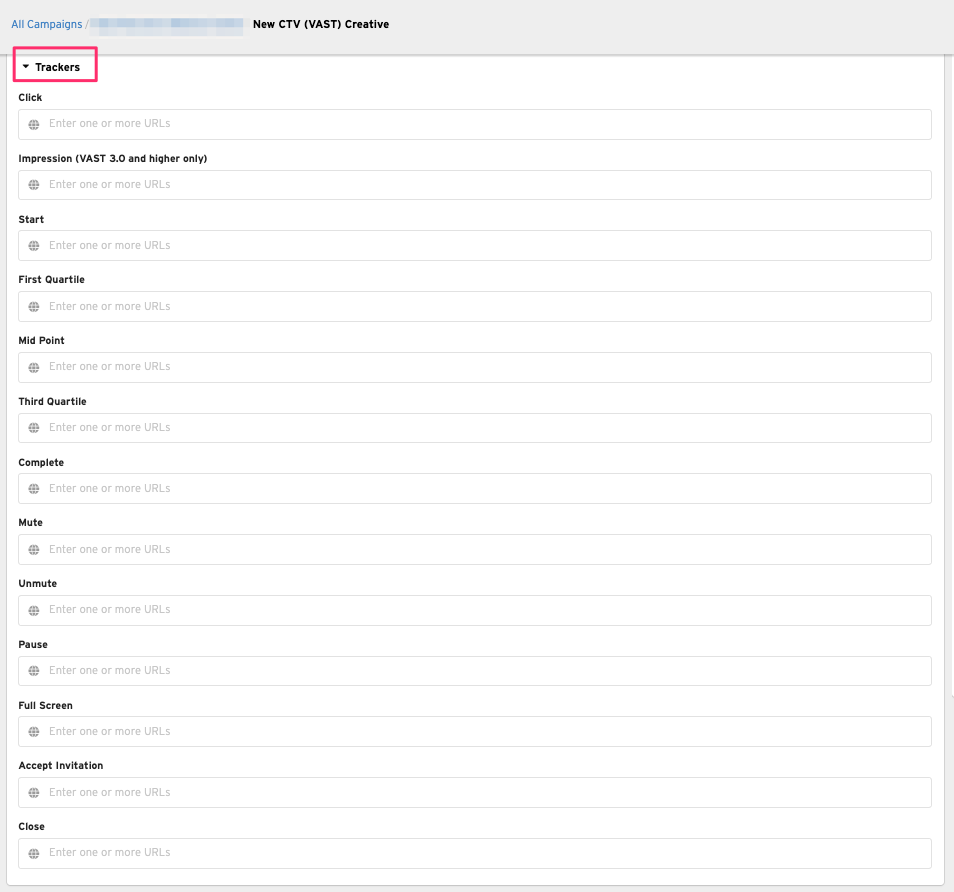
- 0% (Start), 25%, 50%, 75%, 100% Video Complete
- Mute, Unmute
- Video Pause
- Video Maximized
- Accept Invitation
Procedure to Download Campaign Performance Report
1. In Nova UI, click the gear icon next to Campaign
-png.png)
2. Click the Campaign Performance Report button to download the report
-png.png)
3. Click Run and Download after the popup appears to download the report
-png.png)
Campaign Performance Report Example
With the campaign performance report having CTV/OLV creatives, you can find the following summary:
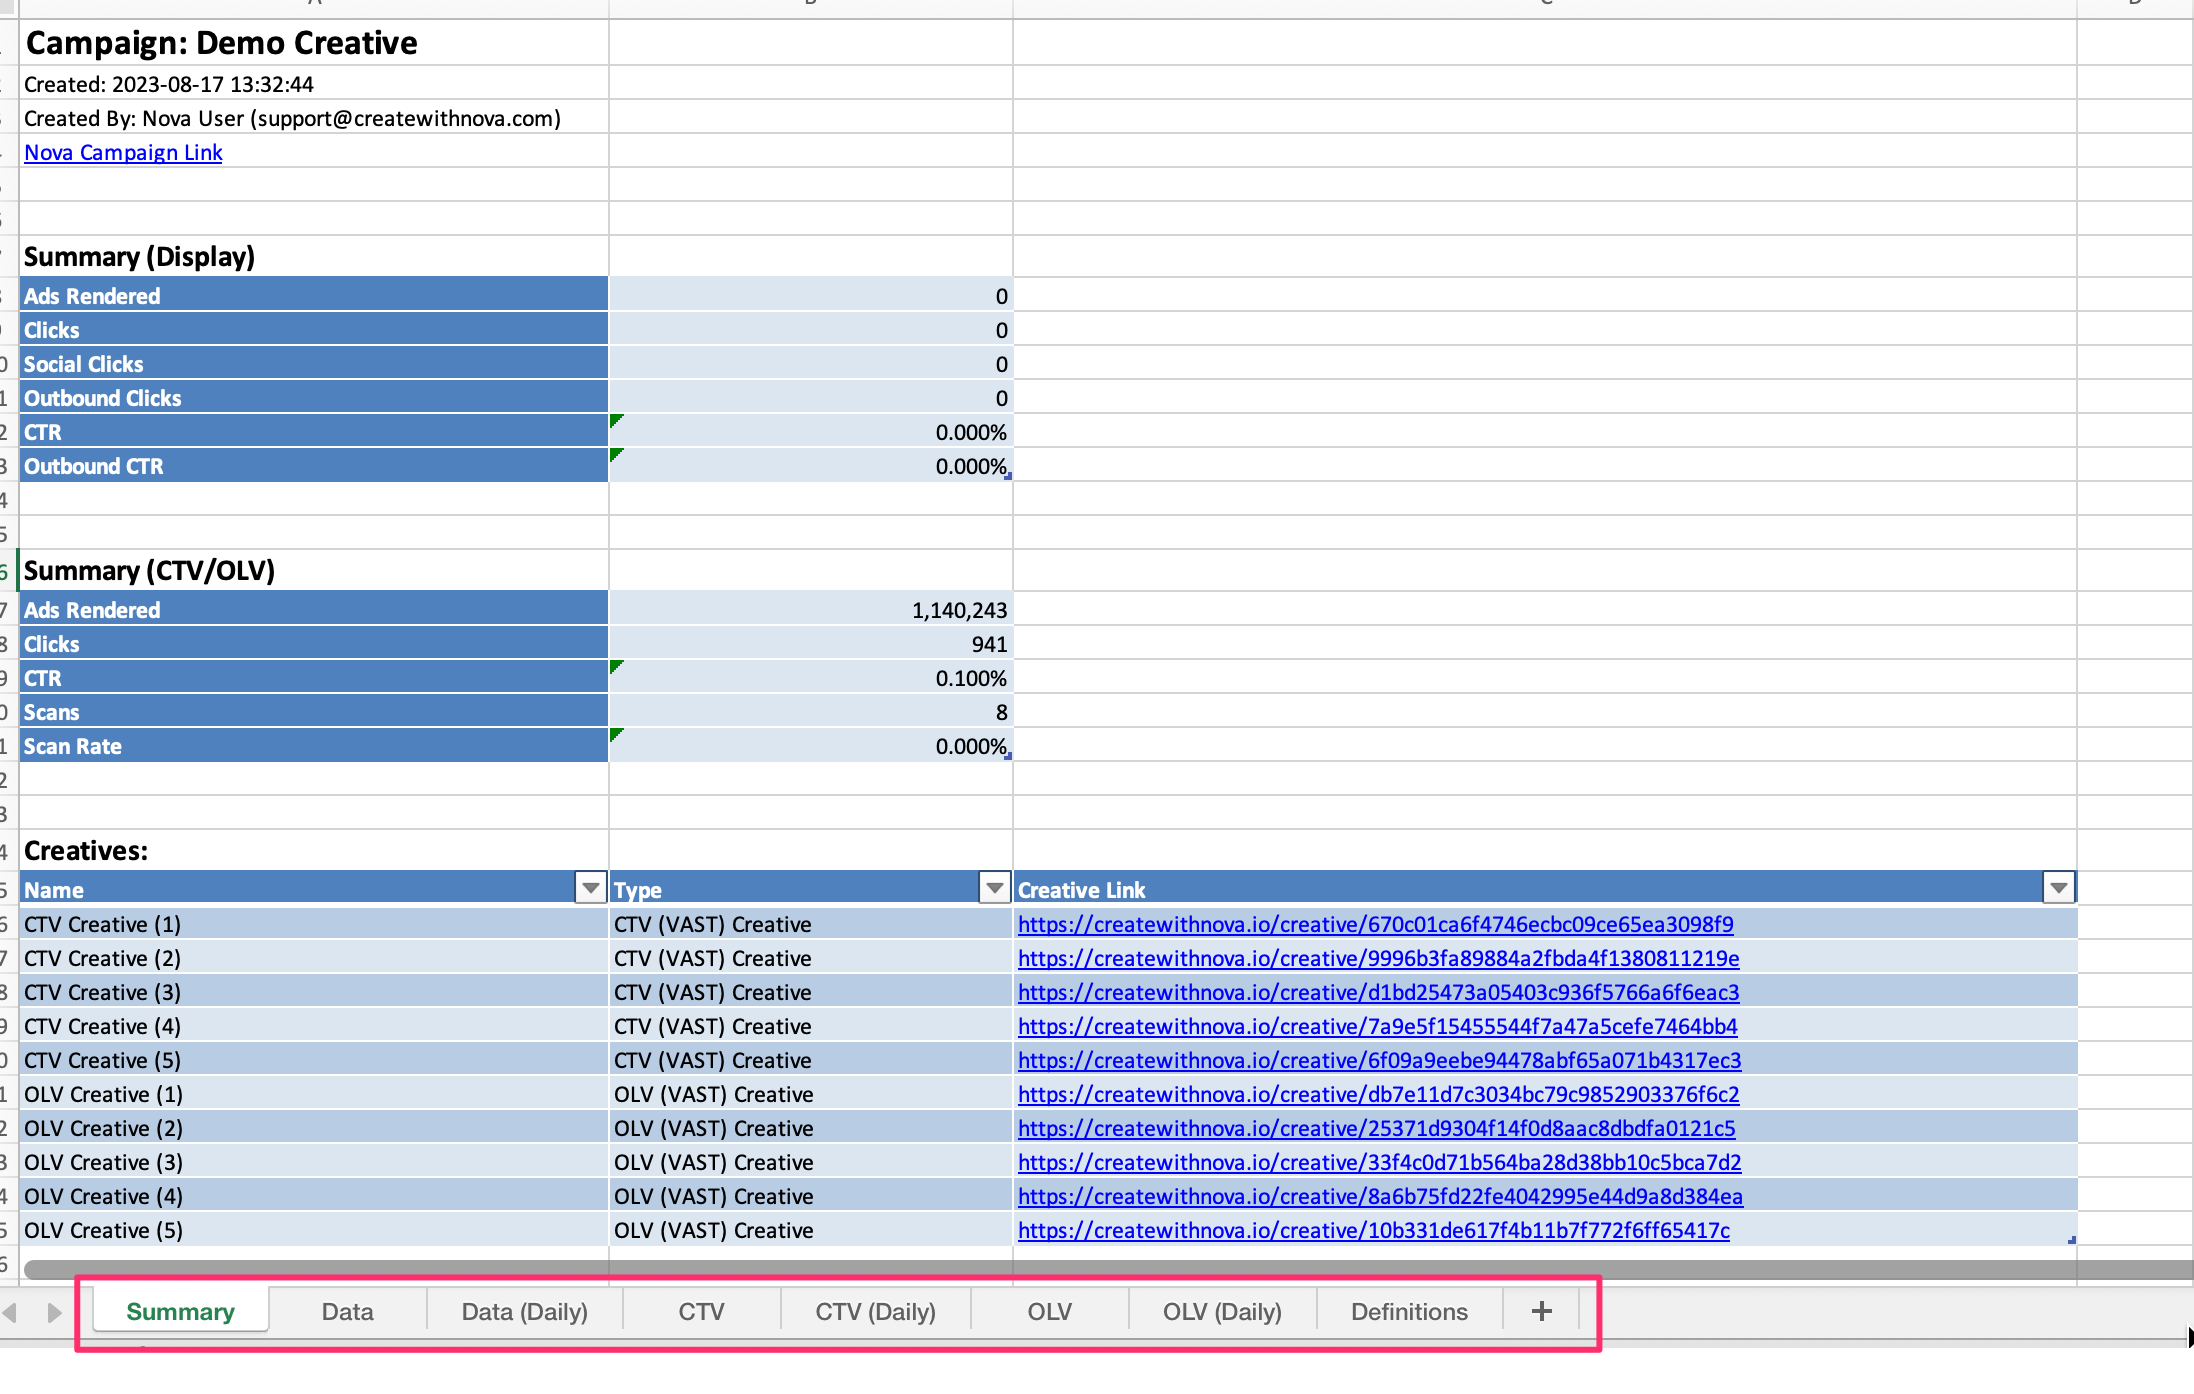
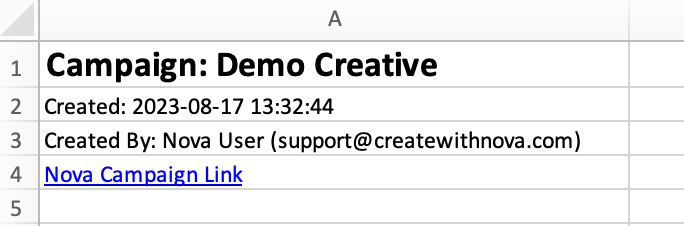
Summary Tab
- The Campaign section includes campaign Name, creation date, the email address of the campaign creator, and the campaign link
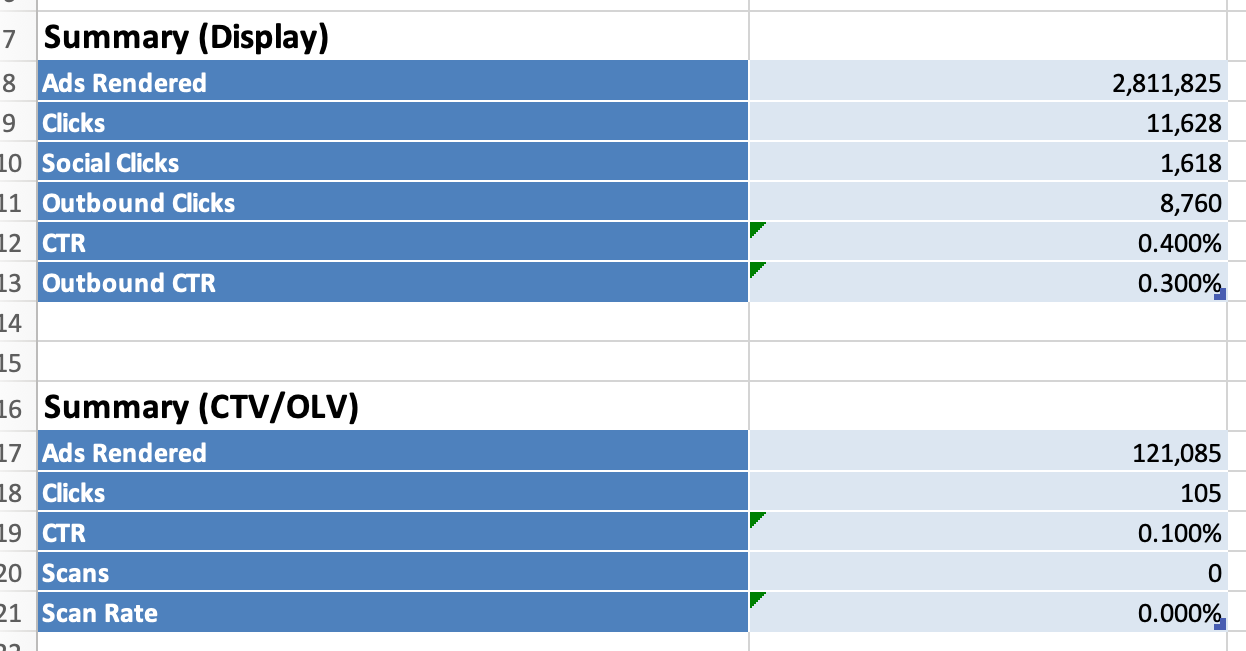
- The Summary (Display) section includes information for Social Display creatives such as number of ads rendered, clicks, social clicks, outbound clicks, CTR and outbound CTR percentages.
- The Summary (CTV/OLV) section includes information for VAST creatives such as number of ads rendered, clicks, CTR percentage, Scans and Scan Rate percentages.
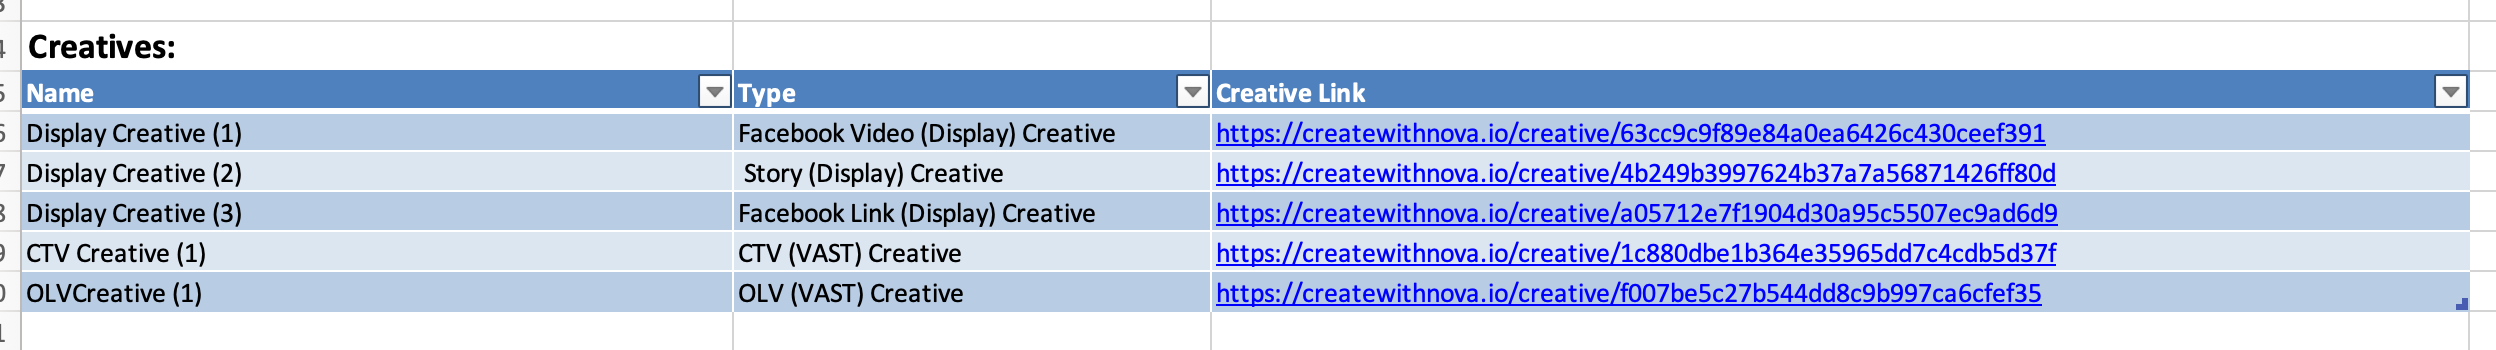
- The Creatives section shows the creative name, type, and link to each
Data Tab
The Data tab includes the creative name and GUID, ads rendered, clicks, CTR, outbound clicks, outbound CTR, social clicks, and post URL for each creative
Data (Daily) Tab
This tab includes the same information included in the Data tab, but breaks it down by day
CTV Tab
The CTV tab includes the creative name and GUID, Device Class, ads rendered, clicks, CTR, Scans, Scan Rate, and Video Metrics for each creative
CTV (Daily) Tab
This tab includes the same information included in the CTV tab, but breaks it down by day
Note: If the "Device Class" is listed as "Unknown", it means that we were unable to categorize/identify it. In such cases, you can refer to the DSP report for more information.
OLV Tab
The OLV tab includes the creative name and GUID, Device Class, ads rendered, clicks, CTR, , and Video Metrics
OLV (Daily) Tab
This tab includes the same information included in the OLV tab, but breaks it down by day
Definitions Tab
The definitions tab gives definitions for each term in the campaign performance report along with additional notes
| Metric | Definition | Other Notes |
| Ads Rendered | The number of ad requests to Nova that are rendered on screen. | Note that when comparing to DFP, the following is expected: Total code served count is greater than Ad server unfiltered downloaded impressions is greater than Ad server impressions is greater than Nova ads rendered. |
| Scans | The count of scans of (or clicks on) an independent call-to-action element present in the ad. | The call-to-action element is typically a 'QR Code'. Note: data is not collected for custom/client-supplied QR codes (in such a case, the number of 'Scans' will always be 0). |
| CTR | Click Through Rate | The click through rate indicates the proportion of rendered ads which were clicked through by the user. |
| Scan Rate | Scan Through Rate | The proportion of rendered ads which were scanned through by the user. |
Have any questions regarding campaign report? Send us your request at support@createwithnova.com